


Just as I once did to an external sound "board" some time ago, and published at diyAudio, I tried to measure the total (input and outout) transfer function of my brother's brand new M-Audio Fast Track Pro.
I used a method called "time stretched pulse", with 2**14 samples, 44100 sps, and using a formula "optimized" from Aoshima's original (AFAIR)
(((this is the octave program to generate the signal, just for reference
N = 2**14;
m=4410;
f = [0:N/2]';
AA = exp(i* ( f*2*pi*(N/2-m)/N +4*m*pi* f.**2 / N**2) );
A = [AA; conj(AA(end-1:-1:2))];
a = real(ifft(A));
)))
The complete transfer function has a nice look:
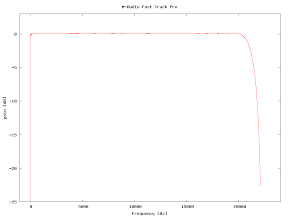
Notice that the end is quite "rounded", different from theoretic perfection, with x Db/decade. I believe it's because of the high order of this filter.
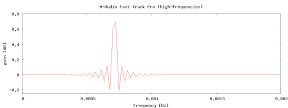
Here is a zoom in the higher freqs:
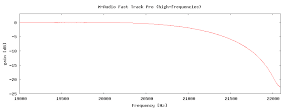
We must remember that it's more important to have a very strong attenuation at the Nyquist frequency then to have a large band, or maintaining the flatness until high freqs. 20kHz is good enough, what you must expect from something "pro"... The last 2100Hz is the space we have to come from 0dB down to -100dB. (100 is an approximation. You must calculate this based on your SNR)
We should notice that the smaller attenuation is not that quite strong... It should have been much stronger!... I'm not sure if the filter is really is letting some aliasing pass by, or if it is my method that could not measure this region appropriately.
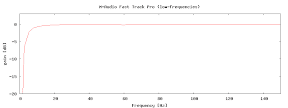
Now the lower freqs. Nice curve, cute:
An now the most interesting, always: zooming the pass band, showing off the ripple.
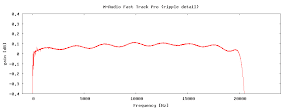
The maximum ripple variation was around 0.1dB, and there is a certain elevation in the half-way. Just to compare, here is the graphic of that audigy I measured.
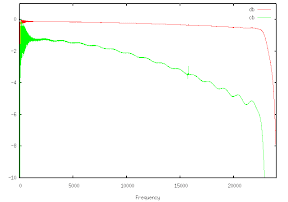
The Audigy also has the ripple, and a slow variation, but in her case the variation is strictly decreasing. The ripple has more peaks, and I guess it has a higher order. The imperssion I got is that Audigy has a better ripple, but a worse "slow" variation. (the cb at the graph means "centibels", it's the other curve multiplied by ten)
And for the grand finale, the impulse response. I felt for it!! Looks just like a sinc! this is something ele that I would like to measure more rigorously someday. Audigy's impulse response looks soooo ugly!
I still have to measure the delay of this M-audio using that crazy subsample thing a guy at jackaudio mail list sent me once...
No comments:
Post a Comment